Blog
Disorganised thoughts, notes, and ephemera about things other than research.
Disorganised thoughts, notes, and ephemera about things other than research.
Lately I’ve been going through lots of little half-finished analyses and trying to write them up in some form. Today it’s my attempt to answer the question “how long does a river stay in spate?”. The primary motivation of this being that when the water level on the Clyde is high it’s not safe to row on it. Clubs, such as Clyde ARC might want to have an idea of how long it will be before the water level is low enough that it’s safe.
I seem to be incapable of just doing something without wondering about the statistics behind it these days.
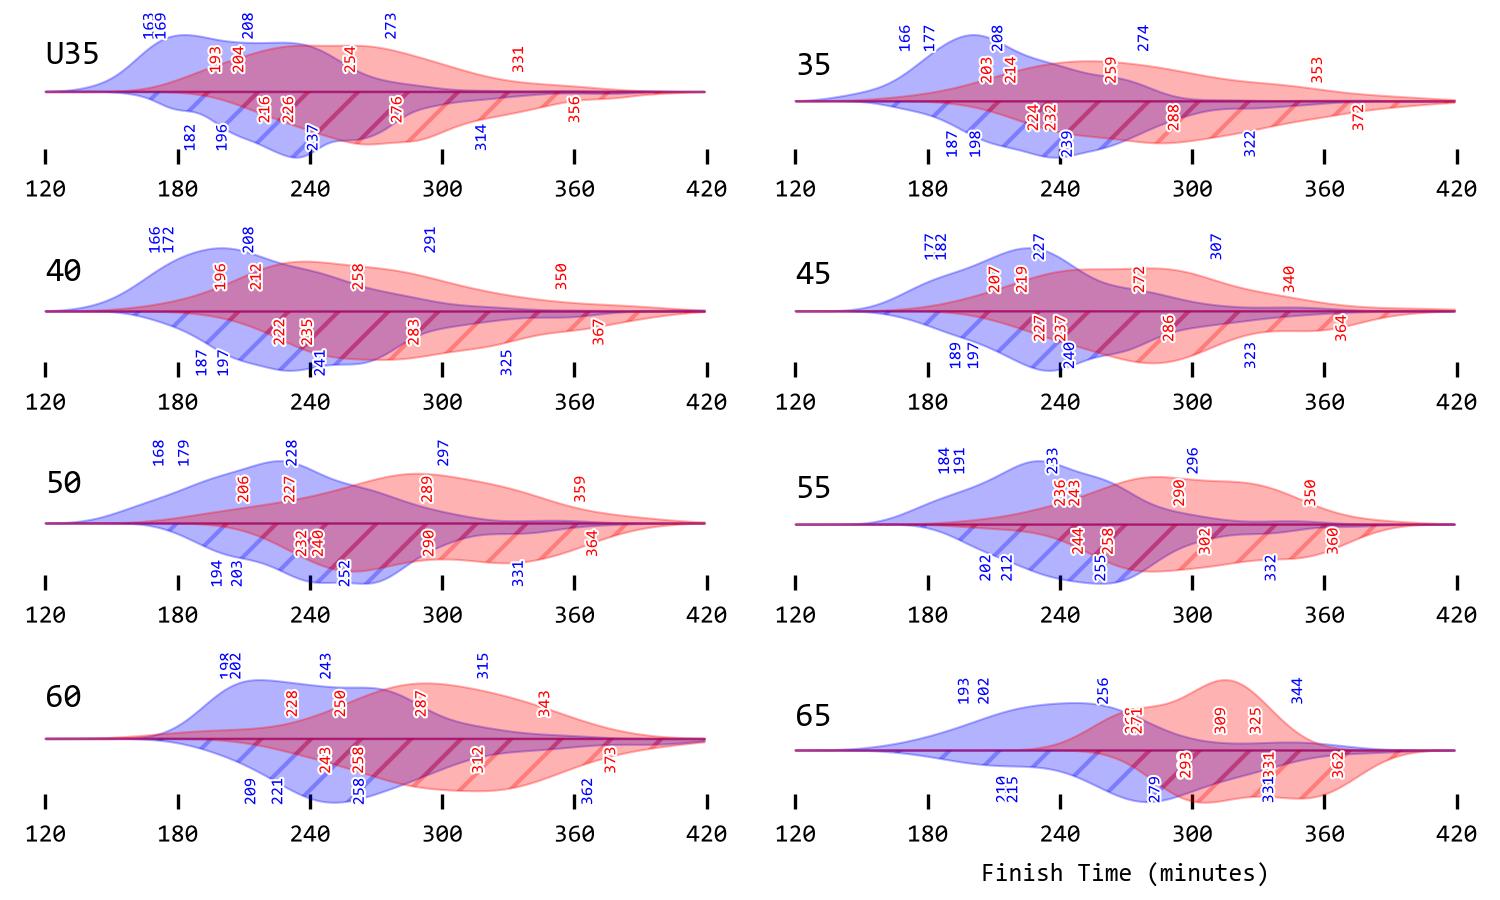
Back in May I ran my first marathon (and I reckon I finished in a decent time, 3h24m. I was aiming for under 3h45m). Much as [when I ran the Glasgow half last year]({% post_url 2023-10-06-whats-a-good-time %}) I found myself wondering how it really compares.
As ever, getting access to the data is a process akin to tooth pulling, but you can get the resulting csv file from this gist.
Every so often I get the notion that I ought to be taking a look at the performance of various rugby teams in various tournaments, and then trying to perform some sort of statistical analysis on it. Well, it looks like this might spin out into a series of blog posts in the run up to the 2023 Mens’ Rugby Union World Cup.
There are twenty teams competing in the tournament, and I’ve had a look at how they’ve performed over the last 4 and a half years (since 1 January 2019) as a precursor to trying to make some slightly cleverer inferences about what might happen in France this year. I’ve had a rather mixed success rate when it comes to predictions in the past, and right now I’m just going to look at the data.
Below is the text of the eulogy I delivered at my father, Frederick John Williams’s funeral on 5 May 2023. We all miss him dearly.
I’m very aware of how difficult my job here this morning will be; to try to summarise, and explain, a life of eighty years, and I don’t have the luxury of a lecture course over which to do it.
A eulogy (from Classical Greek; literally “good words”, or praise) must really just serve as a quick revision lecture, to help you all recall your favourite memories of Fred, and I hope that if you’re able to join us later you will be able to relate some of them to us as we catch-up and reminisce. Of course, when I say “good words”, there’s the risk that you get the impression at this stage that this will all be somehow entirely respectful and reverent. I can assure you my father would have been mortified if he had raised an entirely reverent son!
I’m going to try and be a bit better about regular updates about life, my work, and the Universe. Who knows how it’ll go, but here goes nothing. I’m considering publishing the research part as a standalone newsletter, since we’re rapidly approaching the next gravitational wave observing run, and I regret not keeping a diary during previous ones (though certainly during our O3 run I was rather pre-occupied with finishing my PhD work, writing my thesis, and then passing my viva!). I’m not exactly sure what this will turn into, but let’s see.
A couple of months ago a student who I’ve been working with for the last year or so put out a new first author paper, which was an exciting moment. This is the first time I’ve had a student publish, so I’m enjoying a little buzz of excitement from that, but Weichangfeng should enjoy all the glory of getting the project finished.
You can find the new paper on the arxiv, but I’ll give a quick rundown of what we did in this post.
This post is part of a series of quick astrophysics explainers I’m trying to put together, partly so that I can link to something when I talk about some of these things elsewhere rather than frequently repeating myself! Hopefully it shouldn’t take more than a few minutes to read, and you’ll come away knowing a little more about gravitational waves.
I frequently talk about gravitational waves, and new discoveries which are being made by observing them. But what is a gravitational wave?
I’ve been in Louisiana for almost a week now, and I’m slowly getting over the jet-lag and the change in climate from Glasgow, though I have fallen asleep over my dinner at least twice this week, so maybe I’m not handling it all that well…
My first full day in Louisiana was perhaps a little underwhelming; the hotel I’m staying in is just off a dual carriageway, and there’s no footpath (sidewalk) which goes anywhere. The nearest supermarket is a 30 minute walk away, but it’s on the other side of the road, and I’ve yet to summon up the courage to try crossing it. Fortunately LIGO has provided two cars for me and the four other fellows who are working at the site to use while we’re here. Unfortunately, both of the cars are at the other fellows’ apartments, and I’m, for the moment, in a hotel a couple of miles away. I’m also waiting on my driver’s license arriving from the UK, but that’s an entirely separate story.
0600 (Greenwich Mean Time, T-2.00) Today is the beginning of the adventure, it’s the slow inspiral towards Baton Rouge, and towards LIGO. My day started at 4:30 in the morning, marking the beginning of almost 24 hours worth of travel. My last morning in Glasgow was fairly uneventful, and aside from making sure that I’d bought a final bottle of Irn Bru before leaving Scotland for four months I boarded my flight to Newark.
Chances are at some point in the last year you’ve heard me mentioning that I was heading off to America at some point in my PhD. You might well have heard me complaining about filling out forms to get a visa, about the uncertainty about which part of the USA I was going to, or even about how worried I was that I wouldn’t be able to get about while I was there (through not having a driving license).
Round 10 of the Pro 12 and Aviva Premiership competitions, and Round 13 of the Top 14 are now complete, and we’re running into a two week hiatus while we make the switch to the European Champions and Challenge Cup games for December. It seems like a good time to take stock of how each of the teams are performing compared to how the numbers would suggest they ought to be doing.
The predictions from round 5 were rather successful, with a 100% success rate compared to the results of the games, although the winning margins were a little off.
I’ve updated the presentation of the predictions slightly for this week, with a small image in each row of the table representing the confidence in each result
I’ve been playing around with a large dataset which I scraped off Wikipedia recently: the details of the various fixtures from the Pro12, a European rugby league with teams from Ireland, Wales, Scotland, and Italy.
While I’ve played around with various different ways to visualise the data, I also had a go with performing some analysis on it, specifically performing a Bayesian analysis, with the aim of trying to predict the outcomes of any given match between two teams. This isn’t the first time someone’s tried this sort of thing, but other methods I’ve seen use rankings rather than a full Bayesian approach.
This is a little continuation of the work I did on the data from the Pro12, extended to show the last two seasons of the English Premiership. The graphs are now animated and update to show each team in each season and league.
Now you now click on the part of the edge of the circle relating to a given team the arcs will toggle colours depending on whether that team won or lost (on aggregate).
I’m a couple of months into postgraduate research, and I’ve decided early on that I should probably write a blog about what I’m doing.
My research is centred around attempting to detect gravitational waves. These are tiny ripples in spacetime which are made when black holes (and other exotic cosmic animals) crash into each other, when stars explode, and when the most spherical objects in the universe grow mountains. The current efforts to do this are currently centred around two large detectors in the USA, one in Italy (and soon on in Japan). I’m now part of a collaboration of hundreds of astronomers, physicists, and engineers who built these detectors, and now operate them, which is a pretty humbling experience (and attempting to read the flow of highly technical emails which come through on mailing lists from the collaboration every day has been a pretty efficient way of telling me how little I know about my subject!) Science is probably safe for the moment though; I’m thousands of miles from the detectors, and they don’t let me into the labs where they make the bits in Glasgow. They do let me have a computer, and lots of paper though.
This is a little continuation of the work I did on the data from the Pro12, extended to show the last two seasons of the English Premiership. The graphs are now animated and update to show each team in each season and league.
Now you now click on the part of the edge of the circle relating to a given team the arcs will toggle colours depending on whether that team won or lost (on aggregate).
I’ve taken a bit of time recently to write a simple parser in Python which can read in the Wikipedia format in which rugby match results are presented, which has allowed me to attempt to do some analysis on the data. There’s plenty of information there, but this is a nice, and visually appealing summary of the data. It shows the (aggregate home and away) scores of every team as won off every other team in the Pro 12 (the domestic professional league in Italy, Ireland, Scotland, and Wales) in the 2014/15 season. For example, a chord from Glasgow to Connacht is scaled to show the total number of points Glasgow won off Connacht at the Glasgow end, and vice versa at the Connacht end (if we’re being technical, it’s a representation of the directed graph of the league results… fun.)
I’m sitting on a train which has just left Manchester Oxford Road; I’m tired, shaking a little from an unhealthy dose of caffeine, and just a little bit sad, because CAPS 2015 is over. It’s been a great weekend filled with science, coffee, meeting lots of new people, and even more coffee.
The students from the University of Manchester have done a great job this year of looking after everyone from all across the country, and making the whole conference a fun experience for everyone. I’ve heard talks on topics as diverse as fast radio bursts and magnetic monopoles, and I’ve even had the chance to talk a little about some of my own research, at Jodrell Bank, no less (there can be few places more appropriate to talk about pulsars than in the shadow of Europe’s largest radio telescope after all!).
So, if you’re reading this, you’ve probably discovered that I’ve made yet another change to my website. This one’s quite a big change, certainly in terms of how it’s implemented. In the past I’ve relied on large programs, such as MediaWiki and Wordpress to manage my website. Whilst those are great pieces of software, and good at what they do, they’ve always seemed like overkill for managing a personal website; after all, I doubt very many people ever need to search my blog (and even if they did they’d probably just use Google), so I’ve decided it’s time to move to something simpler.
These are my solutions to Day 1 of the advent of code 2022. Today’s puzzle involved taking a list which was in a very specific format, which contained listings of how many calories a group of elves were carrying in snacks, and determining how many calories each elf was carrying in total.
The majority of the difficulty in this problem arises from dealing with the slightly non-standard data format which is used; each elf lists all of their snacks’ values, then leaves a newline before we get the next elf’s values.
These are my solutions to Day 2 of the advent of code 2022. Today’s puzzle involved working out the score from a game of rock-paper-scissors by parsing a large text document, and then developed into a slightly more complicated variation in the second part. I solved the problem today using C.
{% highlight C %} #include<stdio.h>
int main(){ // First let’s open the file. FILE *fp; char moves[6]; long int grand_total; grand_total = 0; fp = fopen(“input”, “r”);
A couple of weeks ago [I posted some images]({% post_url 2024-08-14-maps %}) from a new map I’d been working on. The motivation behind this was mostly curiosity, though I’ve been dabbling with trying to do things like this in python for a while, before realising that implementing hill-shading was probably more effort than it was worth, and turning to a tool actually designed for this: QGIS.
It turned out learning how to use enough of QGIS to get what I wanted wasn’t all that hard. But of course, that’s where things spiralled, so now I have a complete basemap of Scottish terrain in the new style, which you can [browse here]({% link map.html %}). One day I’ll learn to keep projects simple.
The latest release of asimov is now available from our gitlab server, as well as being available on pypi.
You can install the new version by running
$ pip install -U ligo-asimov
This new version brins a large number of new features which were designed to make running the analyses for a number of upcoming LIGO/Virgo papers easier. These include:
PESummaryAsimov is now reviewed to work with these new pipelines.
In the years I’ve lived in Glasgow I’ve had the chance to experience quite a number of the big events which the city has a tendency to attract: The Commonwealth Games, The UCI Championships, COP-22, those sorts of things. I’ve also had the chance to talk to lots of people about my research, and the science which we do in my research group at the University of Glasgow. Over the last week I had an opportunity to talk to a lot of people at one of these big international events: The World Science Fiction Convention, or WorldCon as it’s known.
I’ve not posted anything on here for a while. I’ve been working a lot. I seem to remember thinking that work would die down after we made the detection announcement last month, but I had something else to work on. That’s because I’m going to our collaboration’s biannual meeting. In Pasadena.
I’ve never left the EU before, and I’ve not been on a plane for almost five years, so I think this could be regarded as a bit of an adventure!
I remember as a child religiously reading the Argos catalogue; probably sometimes looking for Christmas presents, but often just looking at how many things you could possibly buy from one shop. As I got older I started to wonder how on earth they managed to put such a large catalogue together. Five years after the first detection of a gravitational wave signal, I have a little insight into just how hard the latter process is, and a little more appreciation for how much the Universe has to offer.
It’s been a while since I got around to posting on here, and part of the reason for that is that I’ve been on holiday; I took a trip which I started planning five years ago after I first visited Skye, and then never quite got around to doing, because it always seemed to complicated to actually do.
The trip involved cycling from the most southern island in Scotland (well, the most southern large island: a glance at a map reminds me that Ailsa Craig, off the coast of Ayrshire, and Sanda, just to the South of Kintyre, are both further South) to the most northern of the Hebrides (and again I’m cheating on this definition a bit too), the isles of Lewis & Harris, which are actually a single land mass. The whole trip involved nine ferries, twelve islands (and a peninsula), what seemed like hundreds of litres of rain, and nine days of poor internet connectivity (and sometimes a lack of radio reception too). It was all a lot of fun, and so, at the risk of producing a dull I-gone-done-this-on-my-holidays-type post, I’ve got a nice post about what I did on my holidays. For a change there’s almost no physics, statistics, or even programming references, so I guess the blog’s getting a holiday too.
Anyone who has ever visitied or lived in Glasgow is probably aware that it’s a fairly hilly place. You’ll be especially aware of this if you’ve ever lived on one of those hills and reguarly had to cycle or walk up it with shopping! This all left me with a question: just how many hills does Glasgow have?!
There’s a very quick answer to this question: none. By many definitions of what a hill is none of the rises in Glasgow would meet the criteria. I’d argue though, that most of these criteria are oriented towards hills out in the countryside, and that if you’re strolling about town you’re going to notice something smaller as being a hill, and regard it as such. So we don’t need to apply the same criteria here which are used to make Corbetts and Munros. We can, however, take a similar approach, and adjust the criteria appropriately.
1617989
It’s been a while since I posted anything, and I have a big backlog of things to write-up and add to this site. In the meantime, enjoy some maps I’ve made (with the ultimate intention of eventally using them on my route descriptions on the site!).
The maps use data from the Database of British and Irish Hills v17, OpenStreetMap, and the Shuttle Radar Topography Mission.
More is in the works!
This post is a vague collection of things I regarded as moderately noteworthy this week, or interesting things which I found, read, or did during the course of the week. I’m not really sure anyone else would want to read it, but please feel free.
This week I finally closed out work on the updates to the parameter estimation data release for GWTC-2.1. It should be available next week, and will come with updated results for a larger set of events from GWTC-2, which we’ve reanalysed with the same waveforms and pipelines used for the new GWTC-2.1 and the GWTC-3 events.
I realised the other day that it’s been a whole year since I went through the rather stressful experience of PhD interviews (and the even more stressful experience of filling out the forms to apply for the positions). I’ve noticed a few other people around the internet have been recounting their experiences, and since mine are still quite fresh in my memory I thought I would too.
I ended-up applying for five different positions at four universities: some of them were for gravitational wave astrophysics (spoiler: I ended up being accepted for one of those positions), and some were for other types of astronomy. One was for a rather esoteric general relativity theory position, and I’m not sure how to classify it.
Here is another technical note, this time with some code which I keep rewritting in different projects, so I decided to put it all in one place.
Pckaging configuration files in Python is fairly tricky to get right, though there are a number of tools around now which help. It’s also important to make sure that a user can in fact write their own customisations to the configuration somewhere, and that’s a bit tricky.
If you’re looking to try out asimov on your own laptop or workstation you’ll quickly run into a bit of a limitation: asimov, and the codes it works with, are designed to run on a large computing cluster. However, we can get around this by installing a lightweight version of the software used on clusters on your own machine before we try to run asimov.
In a future version asimov will have solutions which don’t require you to go through these steps, but these are very much still in development.
It’s not every day that you start to wonder if a Lovecraftian novella might be writing itself around you. Today I returned to my flat to find, as usual, a bundle of post lying just inside the door. Amongst the Tesco Clubcard Statements, and the usual advertising letter from Virgin Media was a small, rather intriguing brown envelope. It was a bit heavy for a letter, and, perhaps more oddly, was addressed to “Daniel Williams, …, Glasgow, Reino Unido”. Sure enough, the post mark declared its origin as being “Espana”. Well, by this stage I was very intrigued, and so I opened it, braving the threat of possible anthrax infection.
Just shy of six months ago I was at my parents’ house in rural Northern Ireland, nursing a very full stomach, and admiring a large pile of chocolates, and taking a break from Christmas festivities. In fact, it was slightly worse than that; I was starting to make plots for the Burst “companion paper”,now published in PRD!, so I really hadn’t given myself very much time to relax.
As a result of all of this I was aware of some chatter over email about another interesting looking trigger, and before long it became clear that this was something of a Christmas present for us gravitational waves people: it was another binary black hole. A second one, before we’d even had a chance to announce the first. As it became clear that this was a real event it started being tagged the “Christmas Day Event” (it was observed on 25 December local time at the observatories), until somebody burst the bubble, and reminded everyone that we name events based on their time in UT, which put it around 3.30 am on 26 December. Boxing Day. As a result the LSC is today presenting the Boxing Day Event (without any hint of a sale). GW151226, as it’s known to people who love their names with long strings of digits (and people who don’t revel in the joys of Boxing Day) is a very different beast to the one which was unveiled back in February.
I recently ran the Great Scottish Run half marathon in Glasgow, and finished in what I figured was a pretty decent time. But of course, this just leads on to another question: what is a “good” time in the half marathon? Of course, one of the beauties of a sport like running which is so individual is that a good time is really what you make it, and nowhere is that more true than a mass participation event like GSR. But again, before I dive into the statistics, a good time in the half marathon is clearly one that you’re happy with, and comparing yourself to others probably shouldn’t be why you’re running.